What’s Your System Monitoring Solution?
This entry was posted on April 14, 2020 by Nikola Ilić, DevOps Engineer.

Prometheus and Grafana are today's standards in the world of monitoring solutions. If you need an ideal system monitoring solution for the Linux environment, you should definitely consider installing Prometheus and Grafana with exporters best suited for your environment. For the sake of today's task, we are going to use one of the best-known exporters called Node Exporter. It is used for scraping hardware and OS metrics exposed by *NIX kernels, written in Go with pluggable metric collectors. Node Exporter gives us general metrics like CPU, RAM, disk usage and so on. For the purpose of this task, I will be using CentOS 7.6 OpenVZ VPS. So let's cut right to the chase and open some terminals.
System info:
[root@nikola ~]# cat /etc/*release
CentOS Linux release 7.6.1810 (Core)
NAME="CentOS Linux"
VERSION="7 (Core)"
Let's upgrade now.
[root@nikola ~]# yum upgrade -y
We are going to do everything from the terminal on this occasion.
Prometheus
The first step is installing Prometheus.
Downloading the Prometheus source code:
[root@nikola ~]# wget --progress=dot https://github.com/$(wget https://github.com/prometheus/prometheus/releases/ -O - | egrep '/.*/.*/*.linux-amd64.tar.gz' -o)
Creating the needed directories:
[root@nikola ~]# mkdir -p /etc/prometheus
[root@nikola ~]# mkdir -p /var/lib/prometheus
Adding a dedicated user without shell access and home directory:
[root@nikola ~]# useradd --no-create-home --shell /bin/false prometheus
Changing the ownership of the previously created directories:
[root@nikola ~]# chown -R prometheus:prometheus /etc/prometheus
[root@nikola ~]# chown -R prometheus:prometheus /var/lib/prometheus
Unpacking the Prometheus source code:
[root@nikola ~]# tar -xvzf prometheus-*.tar.gz
Copying the files to their dedicated paths:
[root@nikola ~]# cp -r prometheus-*/prometheus /usr/local/bin/
[root@nikola ~]# cp -r prometheus-*/promtool /usr/local/bin/
[root@nikola ~]# cp -r prometheus-*/consoles /etc/prometheus/
[root@nikola ~]# cp -r prometheus-*/console_libraries/ /etc/prometheus/
Changing ownership:
[root@nikola ~]# chown prometheus:prometheus /usr/local/bin/prometheus
[root@nikola ~]# chown prometheus:prometheus /usr/local/bin/promtool
[root@nikola ~]# chown -R prometheus:prometheus /etc/prometheus/consoles
[root@nikola ~]# chown -R prometheus:prometheus /etc/prometheus/console_libraries
Copying the main Prometheus config file and changing its owner:
[root@nikola ~]# cp -r prometheus-*/prometheus.yml /etc/prometheus/
[root@nikola ~]# chown prometheus:prometheus /etc/prometheus/prometheus.yml
Now for the fun part.
Adding custom systemd service:
[root@nikola ~]# cat <<EOF | sudo tee /etc/systemd/system/prometheus.service
[Unit]
Description=Prometheus
Wants=network-online.target
After=network-online.target

[Service]
User=prometheus
Group=prometheus
Type=simple
ExecStart=/usr/local/bin/prometheus \
--config.file /etc/prometheus/prometheus.yml \
--storage.tsdb.path /var/lib/prometheus/ \
--web.console.templates=/etc/prometheus/consoles \
--web.console.libraries=/etc/prometheus/console_libraries

[Install]
WantedBy=multi-user.target
EOF
Systemd daemon needs to be restarted since we have created a new service in the previous step:
[root@nikola ~]# systemctl daemon-reload
Then, it is time to start the Prometheus service and enable it to start automatically at boot:
[root@nikola ~]# systemctl enable --now prometheus && systemctl status prometheus
● prometheus.service - Prometheus
Loaded: loaded (/etc/systemd/system/prometheus.service; disabled; vendor preset: disabled)
Active: active (running) since Sun 2019-07-21 08:19:48 MDT; 10ms ago
Main PID: 1848 (prometheus)
CGroup: /system.slice/prometheus.service
└─1848 /usr/local/bin/prometheus --config.file /etc/prometheus/prometheus.yml --storage.tsdb.path /var/lib/prometheus/ --web.console.templates=/etc/prometheus/consoles --web.console.libraries=/etc/prometheus/console_libraries...
If you have done all the steps correctly you should have a fully functional Prometheus by now.
Node Exporter
The next step is installing Node Exporter:
[root@nikola ~]# wget --progress=dot https://github.com/$(wget https://github.com/prometheus/node_exporter/releases/ -O - | egrep '/.*/.*/*.linux-amd64.tar.gz' -o)
Adding a dedicated user:
[root@nikola ~]# useradd --no-create-home --shell /bin/false nodeusr
Unpacking:
[root@nikola ~]# tar -xvzf node_exporter-*.tar.gz
Copying:
[root@nikola ~]# cp -r node_exporter-*/node_exporter /usr/local/bin/
Ownership:
[root@nikola ~]# chown nodeusr:nodeusr /usr/local/bin/node_exporter
Adding systemd service:
[root@nikola ~]# cat <<EOF | sudo tee /etc/systemd/system/node_exporter.service
[Unit]
Description=Node Exporter
After=network.target

[Service]
User=nodeusr
Group=nodeusr
Type=simple
ExecStart=/usr/local/bin/node_exporter

[Install]
WantedBy=multi-user.target
EOF
Systemd daemon reload:
[root@nikola ~]# systemctl daemon-reload
Starting the Node Exporter service and enabling it at boot sequence:
[root@nikola ~]# systemctl enable --now node_exporter && systemctl status node_exporter
● node_exporter.service - Node Exporter
Loaded: loaded (/etc/systemd/system/node_exporter.service; disabled; vendor preset: disabled)
Active: active (running) since Sun 2019-07-21 08:22:59 MDT; 7ms ago
Main PID: 1901 (node_exporter)
CGroup: /system.slice/node_exporter.service
└─1901 /usr/local/bin/node_exporter

Jul 21 08:22:59 nikola systemd[1]: Started Node Exporter.
Grafana
The last step is installing Grafana. We will be using the official Grafana repo as our installation source.
Adding repo:
[root@nikola ~]# cat <<EOF | sudo tee /etc/yum.repos.d/grafana.repo
[grafana]
name=grafana
baseurl=https://packages.grafana.com/oss/rpm
repo_gpgcheck=1
enabled=1
gpgcheck=1
gpgkey=https://packages.grafana.com/gpg.key
sslverify=1
sslcacert=/etc/pki/tls/certs/ca-bundle.crt
EOF
Installing Grafana:
[root@nikola ~]# yum install grafana -y
Starting Grafana and checking its status:
[root@nikola ~]# systemctl enable --now grafana-server && systemctl status grafana-server
● grafana-server.service - Grafana instance
Loaded: loaded (/usr/lib/systemd/system/grafana-server.service; disabled; vendor preset: disabled)
Active: active (running) since Sun 2019-07-21 08:25:10 MDT; 6ms ago
Docs: http://docs.grafana.org
Main PID: 2018 (grafana-server)
CGroup: /system.slice/grafana-server.service
└─2018 /usr/sbin/grafana-server --config=/etc/grafana/grafana.ini --pidfile=/var/run/grafana/grafana-server.pid --packaging=rpm cfg:default.paths.logs=/var/log/grafana cfg:default.paths.data=/var/lib/grafana cfg:default.path...
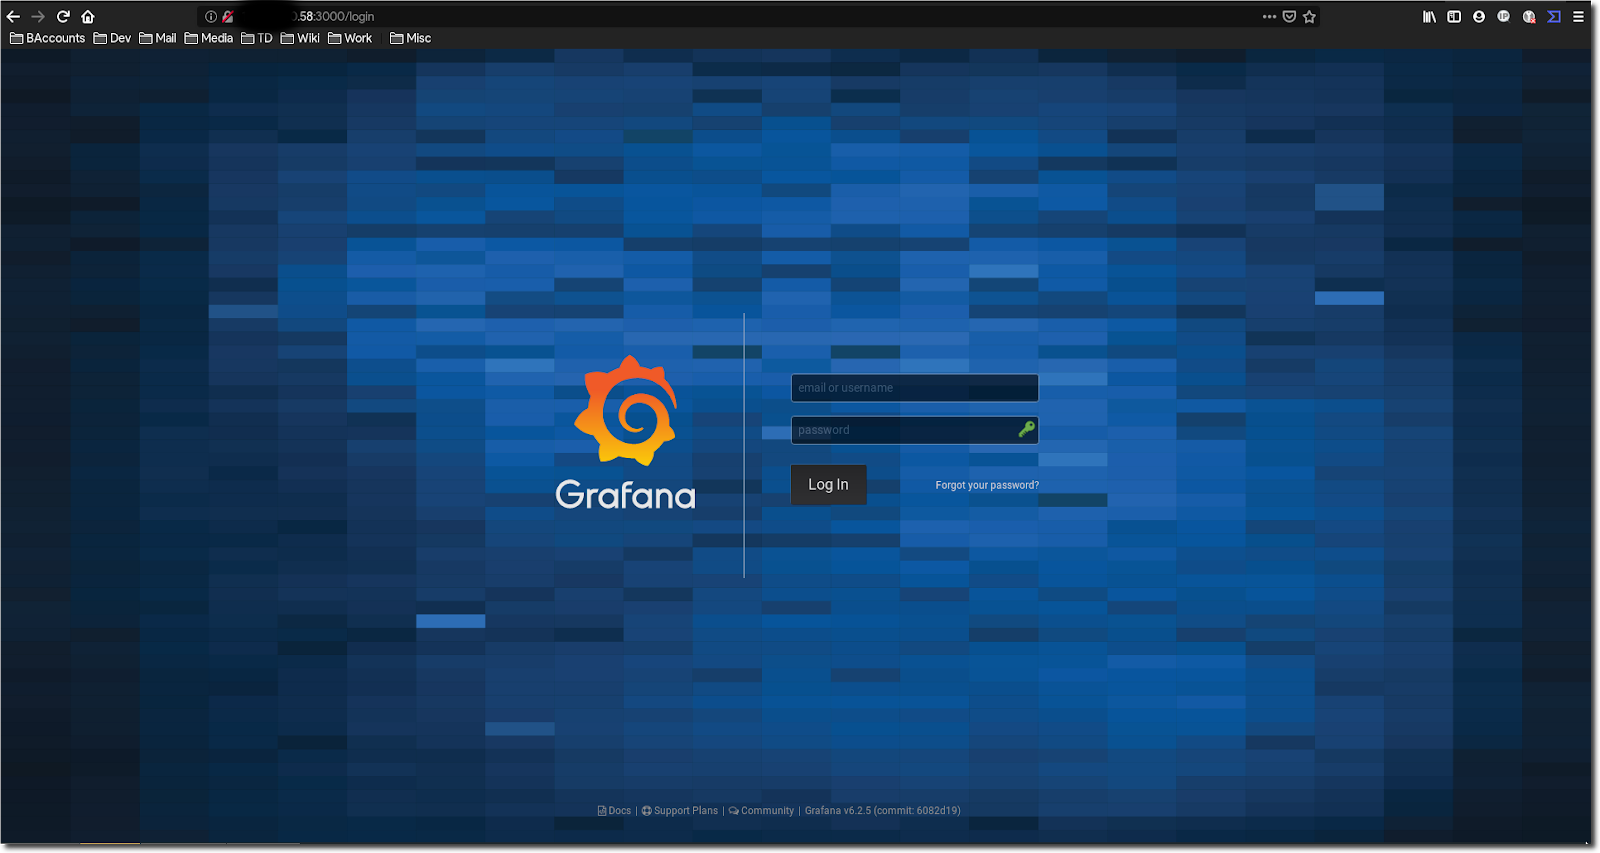
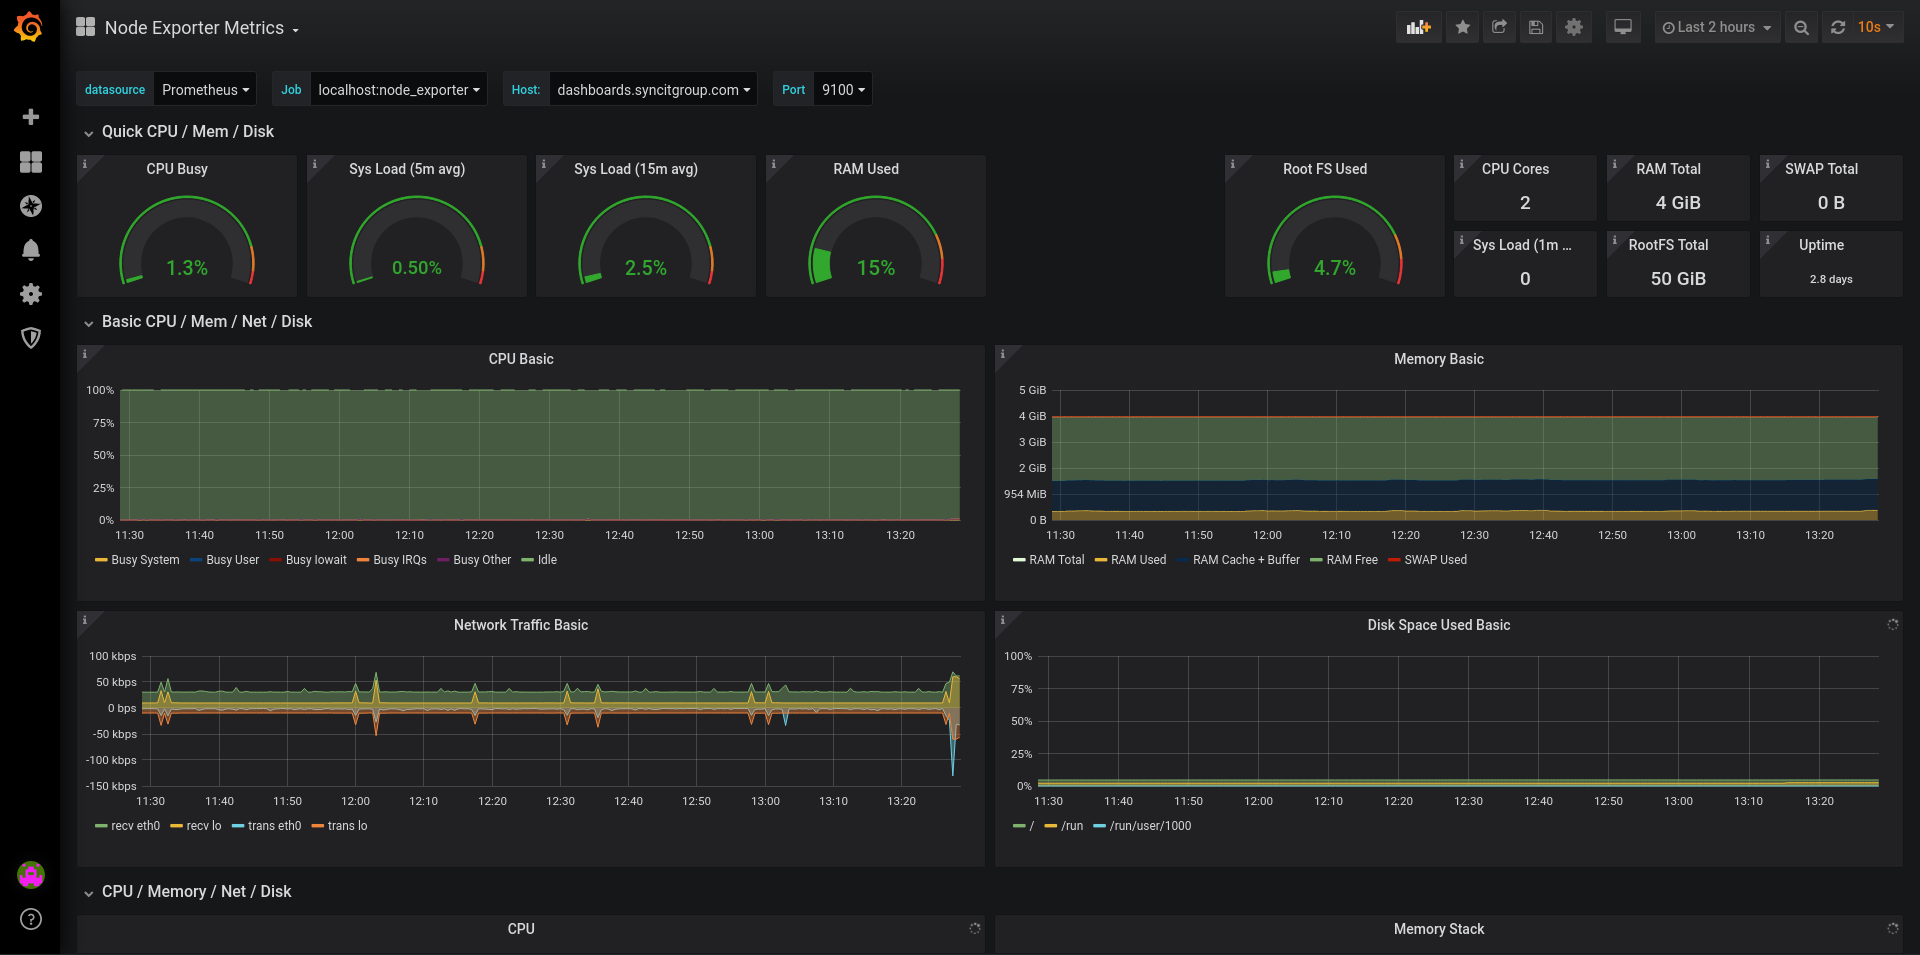
If you have done everything right, you will be able to access your new shining monitoring at:
http://FQDN or IP:3000
Default user: admin
Default password: admin
In case you are experiencing any issues while opening the URL, please check your firewall settings and open ports.
Wrap Up
When we meet again we will create custom graphs, set up email and other channels of notifications, and much more. Until then, read our Blog, follow us on Social Networks to keep up with our latest innovations, and contact us at [email protected] in case you have any questions regarding any aspect of our expertise.
#Until next time.
#Kind regards

#Nikola Ilic
#Senior Linux System Administrator / DevOps Rookie
This entry was posted in Linux and tagged Web Development, SyncIt Group, Web, Linux, Linux Development, Linux Environment, System Monitoring Solutions, Prometheus, Grafana, Node Exporter on April 14, 2020 by Nikola Ilić, DevOps Engineer .